I tried applying Fourier transform to some of my images and was able to observe interesting results. MATLAB actually makes it very easy to try out. Tutorial on how to do it here : https://www.mathworks.com/help/images/fourier-transform.html
It also allows application of frequency filters (low-pass, band etc.) which can show how different parts of the frequency affect your image.
seanxu
Given a frequency spectrum, can we reconstruct the original image? If so, how? I didn't quite understand the transformation relationship between the original and the frequency spectrum.
apham
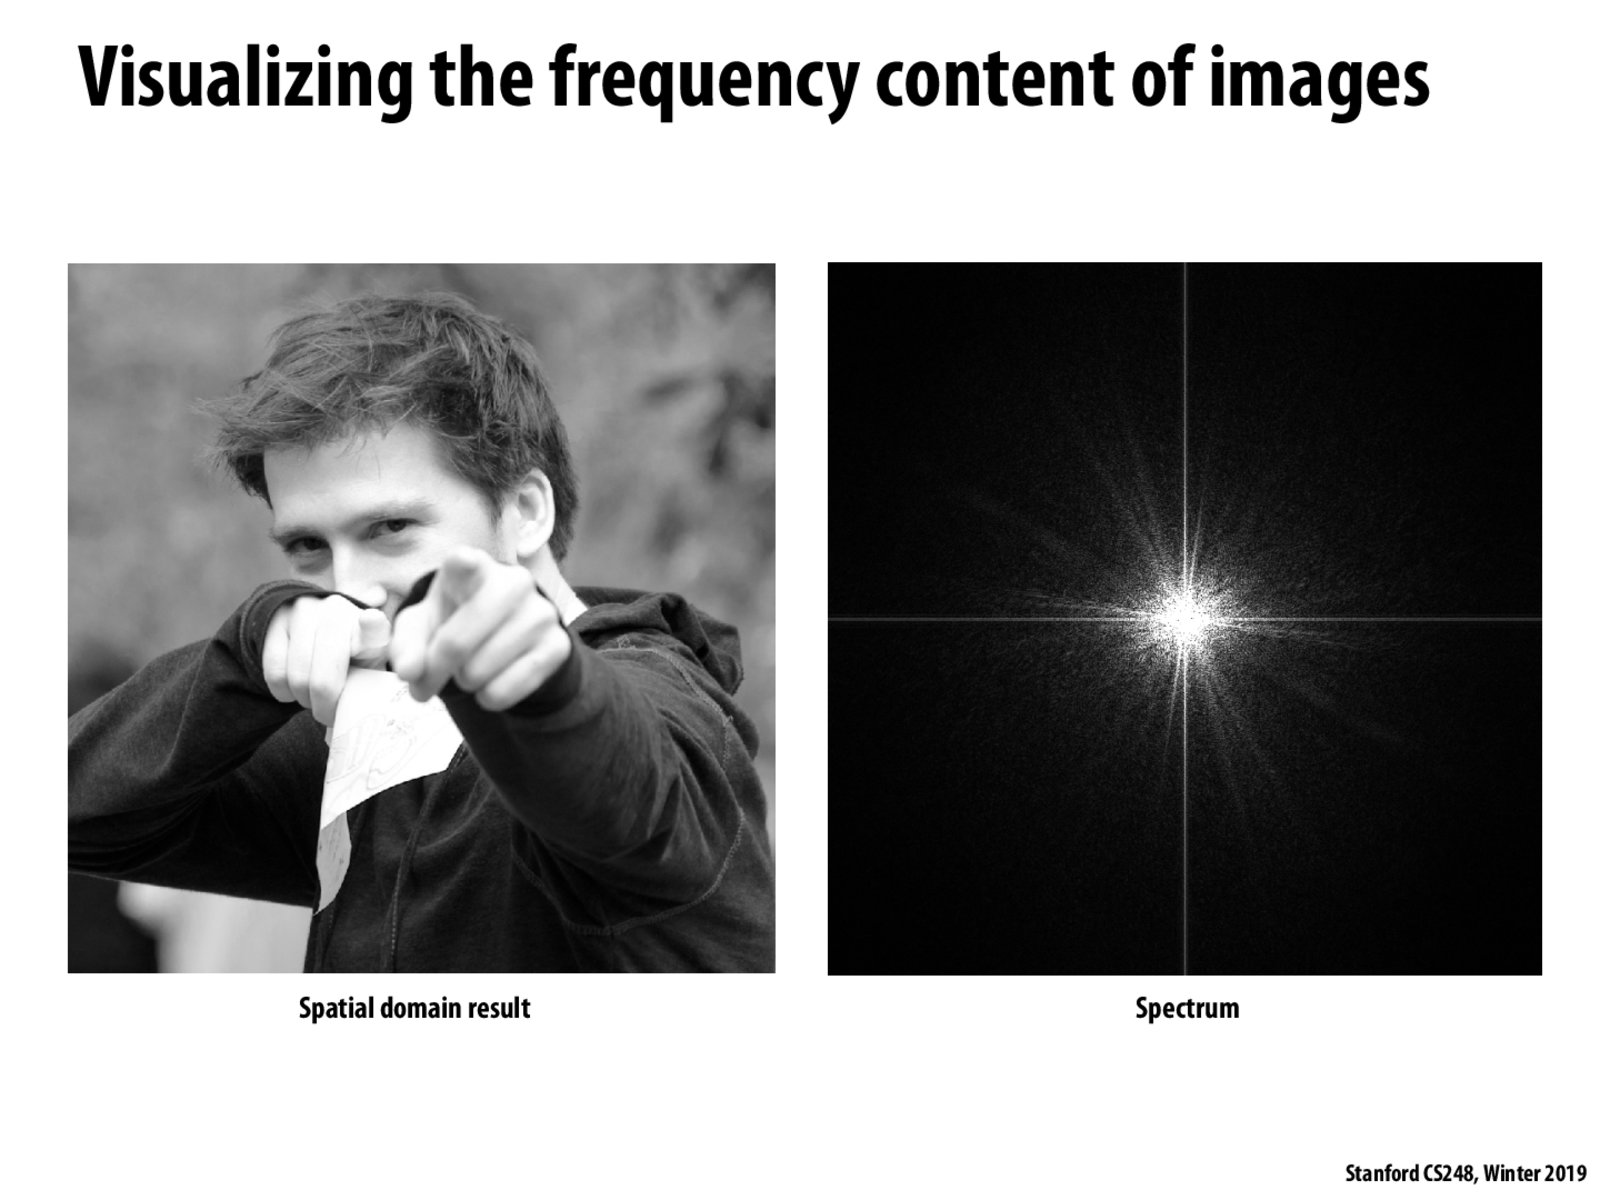
Is the spectrum on the right just a fourier transform of the original image? If so, what exactly does that mean?
jballouz
Here when plotting the spectrum, we are plotting only the magnitude at a certain frequency I assume and not the phase (?)
yueli96
Is the spectrum symmetrical? Is there axis with different meaning in the spectrum?
I tried applying Fourier transform to some of my images and was able to observe interesting results. MATLAB actually makes it very easy to try out. Tutorial on how to do it here : https://www.mathworks.com/help/images/fourier-transform.html It also allows application of frequency filters (low-pass, band etc.) which can show how different parts of the frequency affect your image.
Given a frequency spectrum, can we reconstruct the original image? If so, how? I didn't quite understand the transformation relationship between the original and the frequency spectrum.
Is the spectrum on the right just a fourier transform of the original image? If so, what exactly does that mean?
Here when plotting the spectrum, we are plotting only the magnitude at a certain frequency I assume and not the phase (?)
Is the spectrum symmetrical? Is there axis with different meaning in the spectrum?