In our first assignment is this what the function fill_sample is supposed to do, drawing out a small dot? I feel confused about how to draw a small circle inside a pixel, what could it be that I misinterpret? Thanks
Erawn1
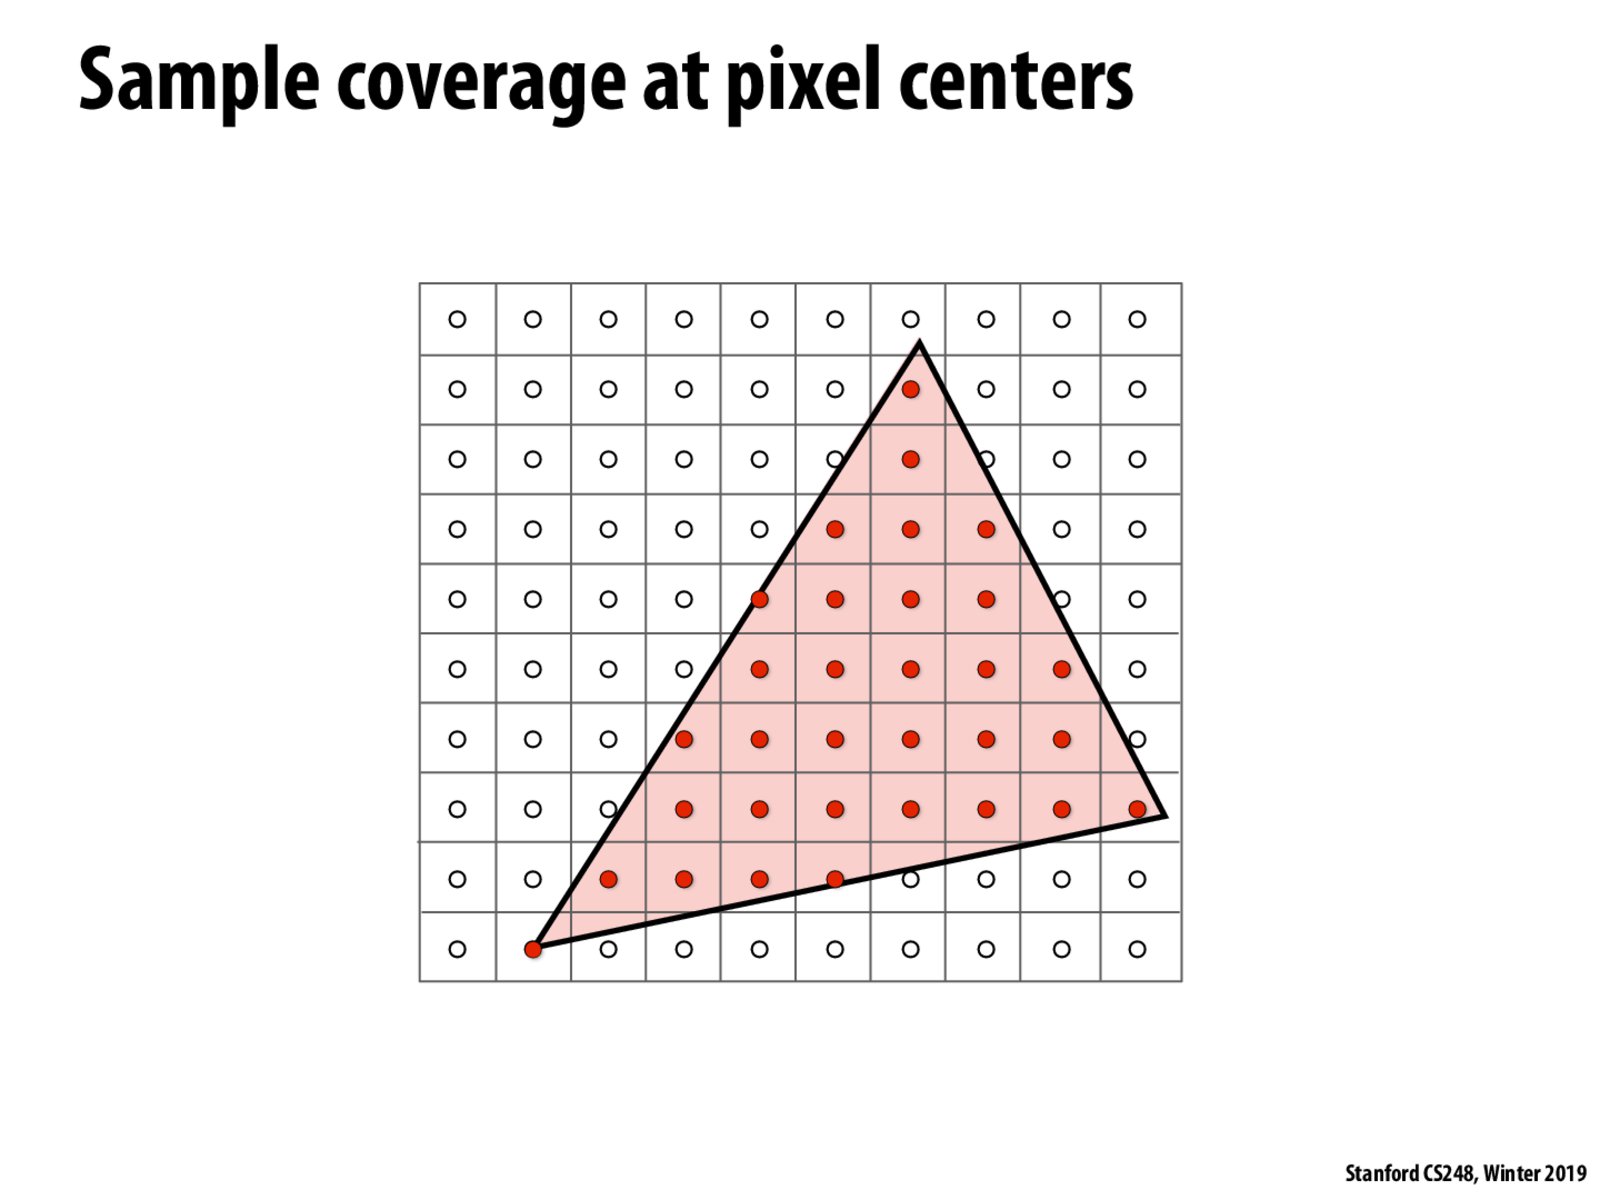
@Spantheras - Think about the dots as points of measurement - imagine a tank of water that you're sticking a thermometer into - for each (X,Y) location in the tank, you could get a numerical reading, but you can't sample infinitely, so you decide to sample every inch or so. That is what is being communicated in this image- simply that for every pixel, you make a measurement in the center and get back a number, just as if you took a temperature in the middle of a 1x1 inch square in the tank. Maybe a measurement every inch gives you the resolution you need, but if it doesn't, you need to go back and take one every half inch, or quarter inch.
The dots are saying that for every square you measure in, you're making an assumption that your measurement in the center is representative of the whole area (for each red dot we should color the whole pixel red) In reality it is often not, which leads to taking more measurements per square via supersampling.
isalinas
As detailed as it was in making his point, and with all due respect to all his accomplishments, I personally found Alvy Ray Smith's article A Pixel Is Not A Little Square... a bit rambling for me to fully understand the depth of his argument. A quick search led me to this article by Mike Gleicher.
If you're watching lecture 2 on mvideox, Kayvon does a good job of explaining this at the 43 minute mark (slide 55).
In our first assignment is this what the function fill_sample is supposed to do, drawing out a small dot? I feel confused about how to draw a small circle inside a pixel, what could it be that I misinterpret? Thanks
@Spantheras - Think about the dots as points of measurement - imagine a tank of water that you're sticking a thermometer into - for each (X,Y) location in the tank, you could get a numerical reading, but you can't sample infinitely, so you decide to sample every inch or so. That is what is being communicated in this image- simply that for every pixel, you make a measurement in the center and get back a number, just as if you took a temperature in the middle of a 1x1 inch square in the tank. Maybe a measurement every inch gives you the resolution you need, but if it doesn't, you need to go back and take one every half inch, or quarter inch.
The dots are saying that for every square you measure in, you're making an assumption that your measurement in the center is representative of the whole area (for each red dot we should color the whole pixel red) In reality it is often not, which leads to taking more measurements per square via supersampling.
As detailed as it was in making his point, and with all due respect to all his accomplishments, I personally found Alvy Ray Smith's article A Pixel Is Not A Little Square... a bit rambling for me to fully understand the depth of his argument. A quick search led me to this article by Mike Gleicher. If you're watching lecture 2 on mvideox, Kayvon does a good job of explaining this at the 43 minute mark (slide 55).